Technologies Used:
HTML, CSS, JS, P5.js, Leaflet.js, Adobe Photoshop, Figma
YorCreature was an idea that I came up with in first year, and finally developed as part of the second year WADD (Web Application Design and Development) module. I decided to demonstrate my learning by creating a website that could be used to view and document the wildlife seen on campus. This is done with three pages: a page to see a map of whats on campus, a page to enter wildlife you have seen, and a page to view statistics to do with the wildlife seen on campus. Leaflet.js is a JavaScript library that I used to display the maps on the webpage. I wanted to explore new libraries, as I had previously only really worked with P5.js. The main focus of my website was technical development - in this case, how well my HTML is structured, my use of CSS, and how efficient my JS code is. As this website is a prototype and not hosted on a public server, I used a Google Sheets file as a mock database to hold information. This allowed me to practice programming the writing and retrieving of data on a web server, instead of just working with client data.
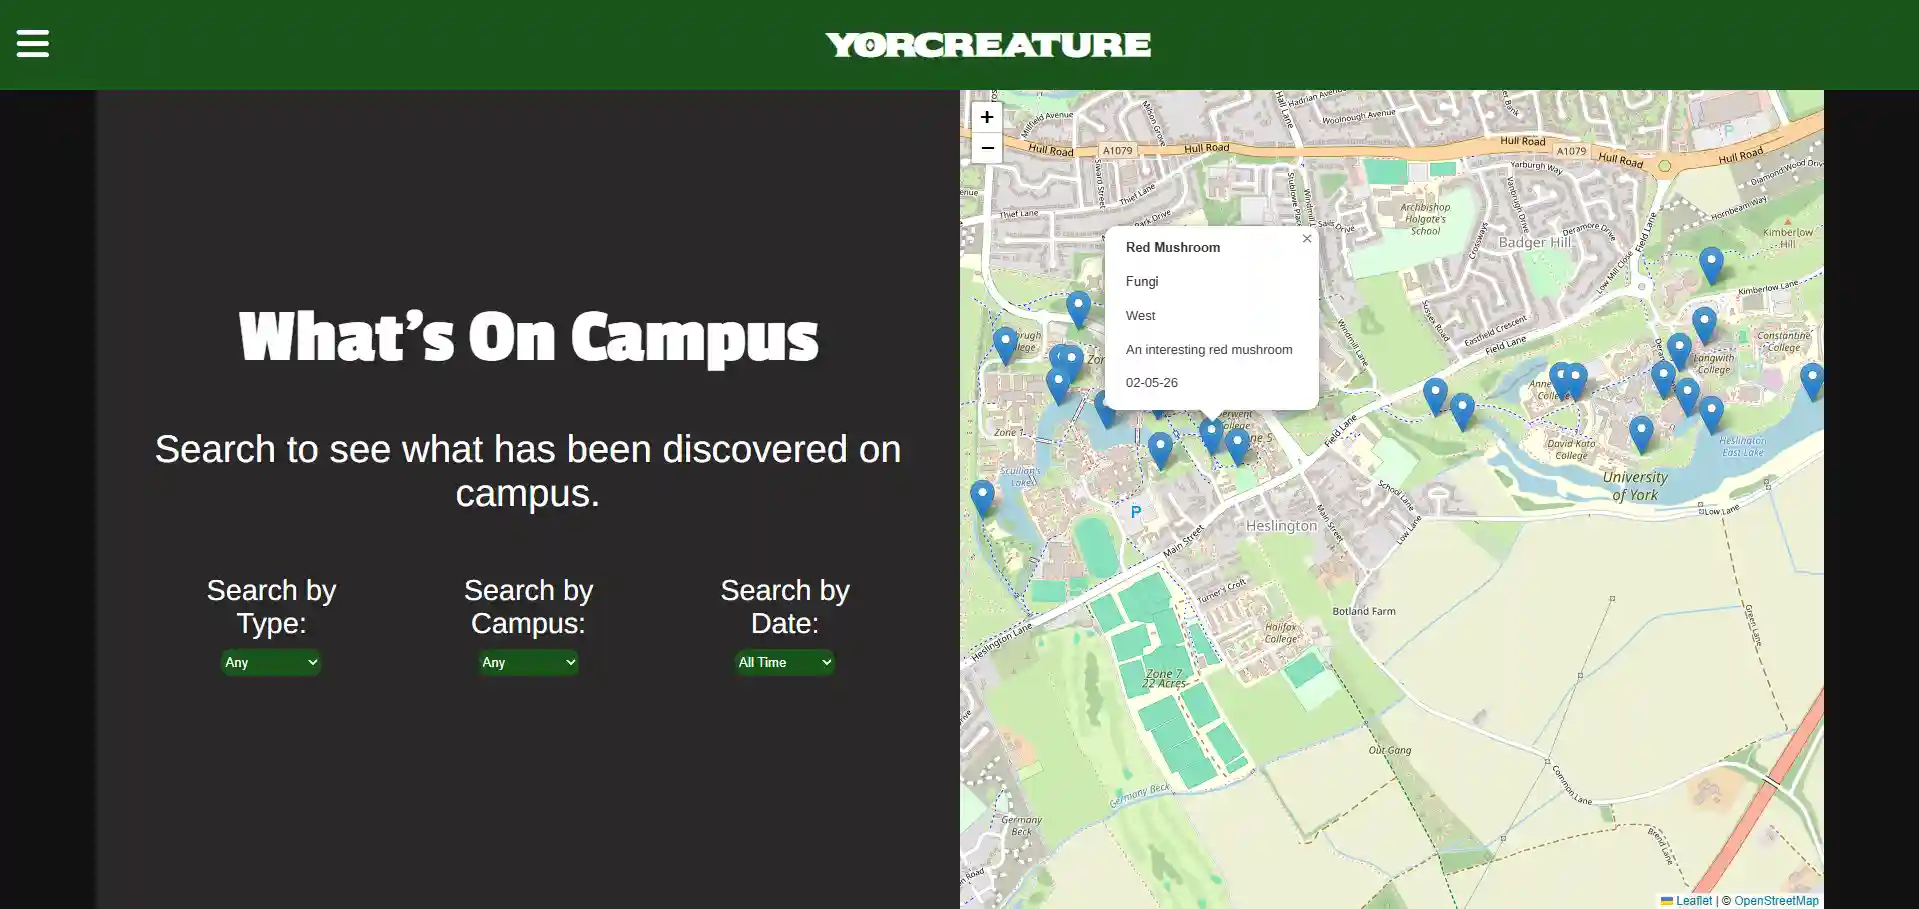
The "on campus" page contains a map with markers showing the location and details of wildlife. Dropdowns on the left allow for the user to filter the markers displayed by type (such as mammal, bird, plant etc.), campus east/west, and the date it was logged. Building up this functionality was a fun exercise in improving user experience. Making some popups appear on a map was the original, barebones stage of this page. From there, I found that adding some criteria to sort by could make the map easier to follow, and making these filters update automatically when clicked on saves the user from unneccessary effort.
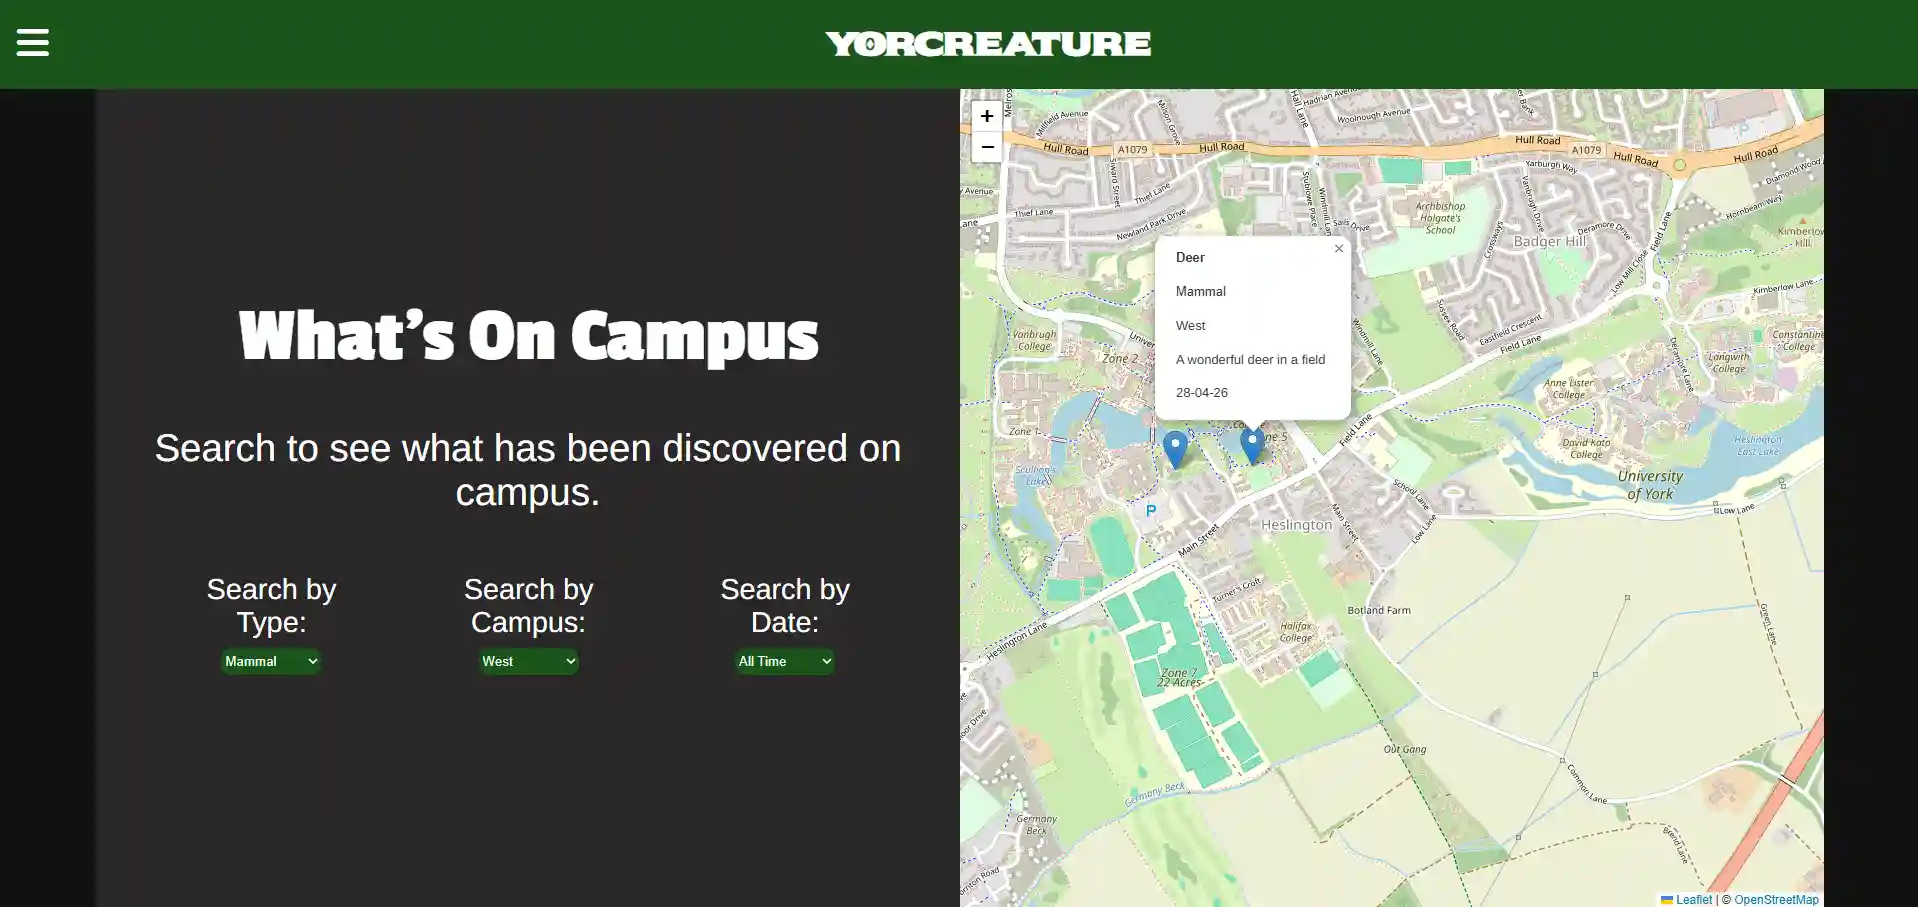
The map with all entries visible (left). The map with only mammals on west campus visible (right).
The "log creature" page has a button on the left half that allows for a wildlife sighting to be recorded. Clicking on this button opens up a form, which records data such as the name, type and campus the creature was seen on. It also fills in the current date (as set on the device), and the user must place a marker on the map to show the location of the sighting. This information is then written to the database, where it is used where necessary (for example displayed as a marker on the "on campus" page). A panel on the right contains a record of all creatures that the user has entered, and can be clicked on to view the specifics of that particular creature.
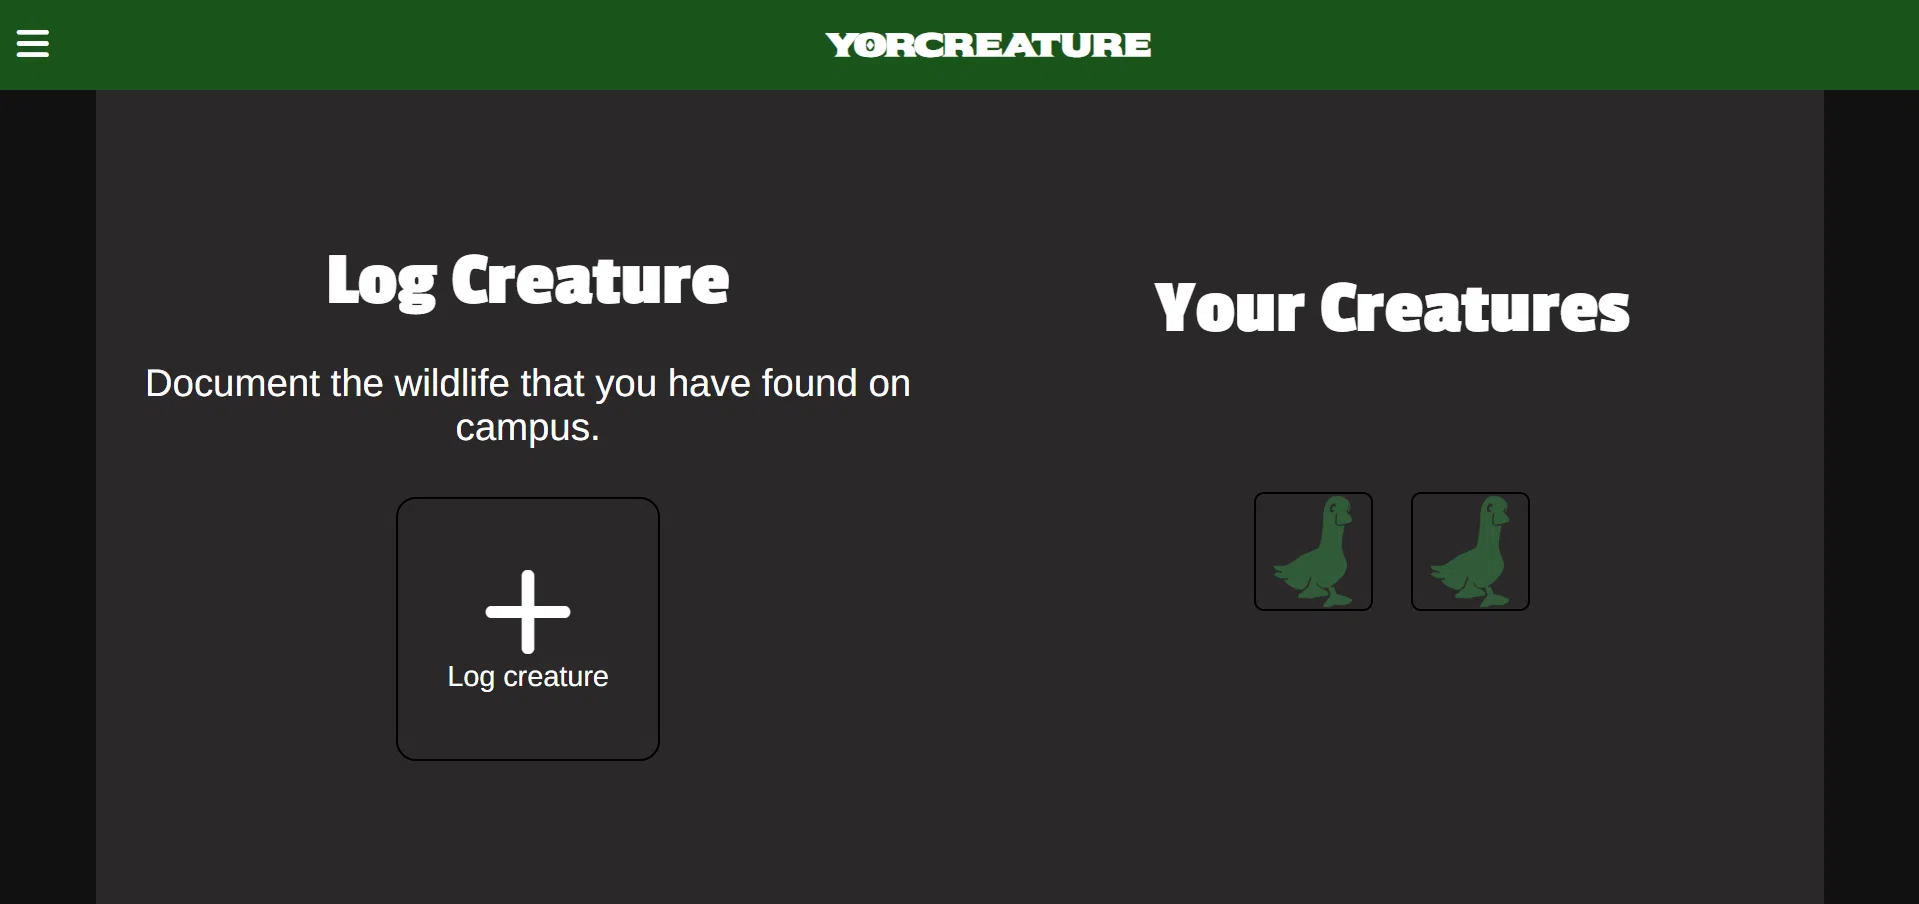
The "log creature" page, with two creatures already recorded.
The final page is the "creature stats" page. This fills in graphs with data about the number of different types of wildlife seen, the number of creatures seen on each campus, and how many creatures were seen on each date. These graphs were written as a JavaScript class so that the code could be easily read and reused. This pushes my previous knowledge of the P5.js library, as this is what I used to draw the graphs. The class takes in a p5 canvas object to draw to (allowing for multiple canvases on the same page), an object of data read from the database, the type of data being drawn to the graph (eg. type, campus, date), and the div container that the graph will be in. It then creates an empty object template of the data being counted, after which it iterates through the provided data to fill this in. The result is an object with key:value pairs (for example mammal: 2, bird: 4, plant: 1 and so on). The largest value is recorded, as this is used to draw the maximum bar level and also to create the scale that the bar increases by. Once this is calculated, the graphs can be drawn by working out where each bar and text label should be placed.
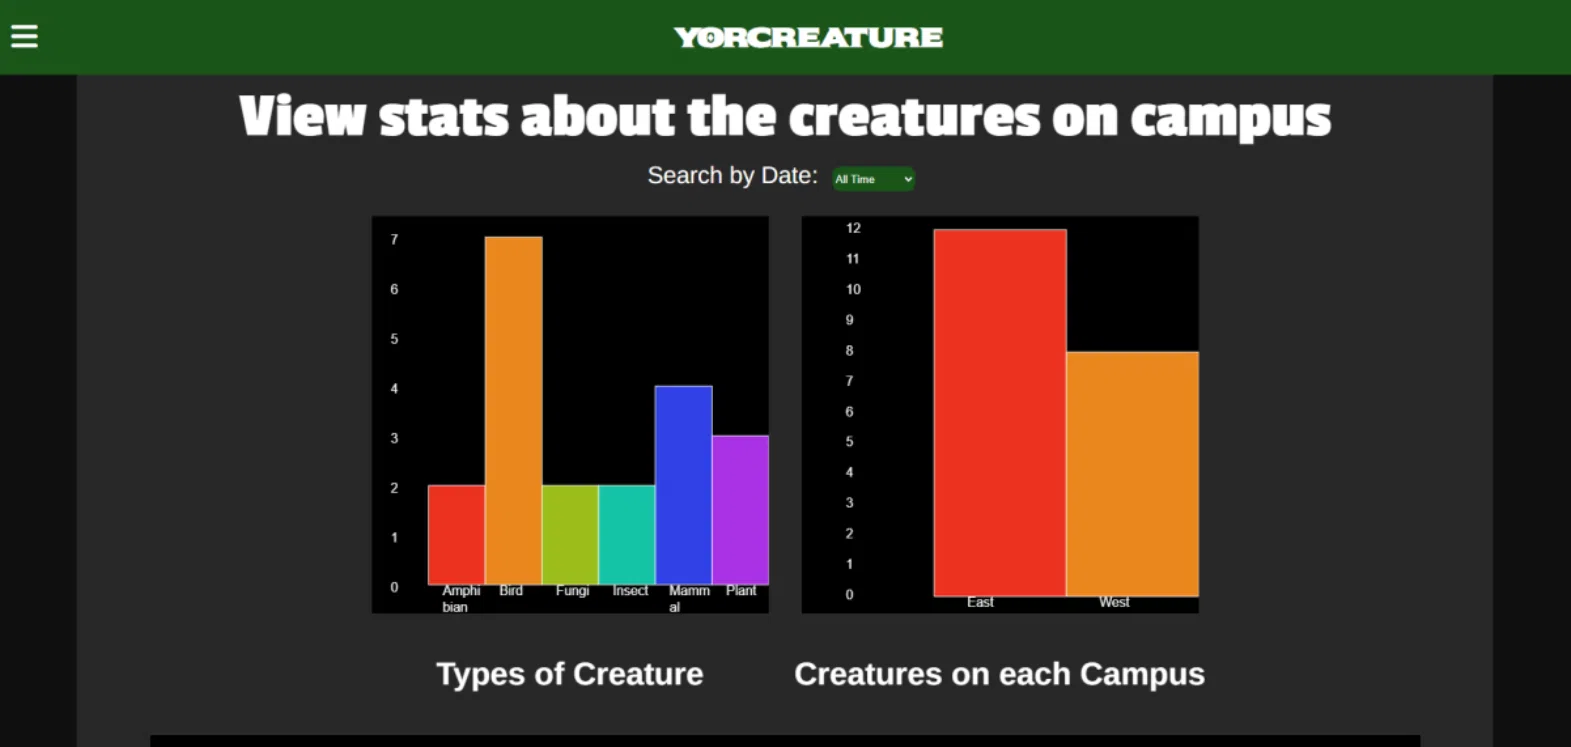
The "creature stats" page with two graphs visible.